Threat Intelligence Insights
Context
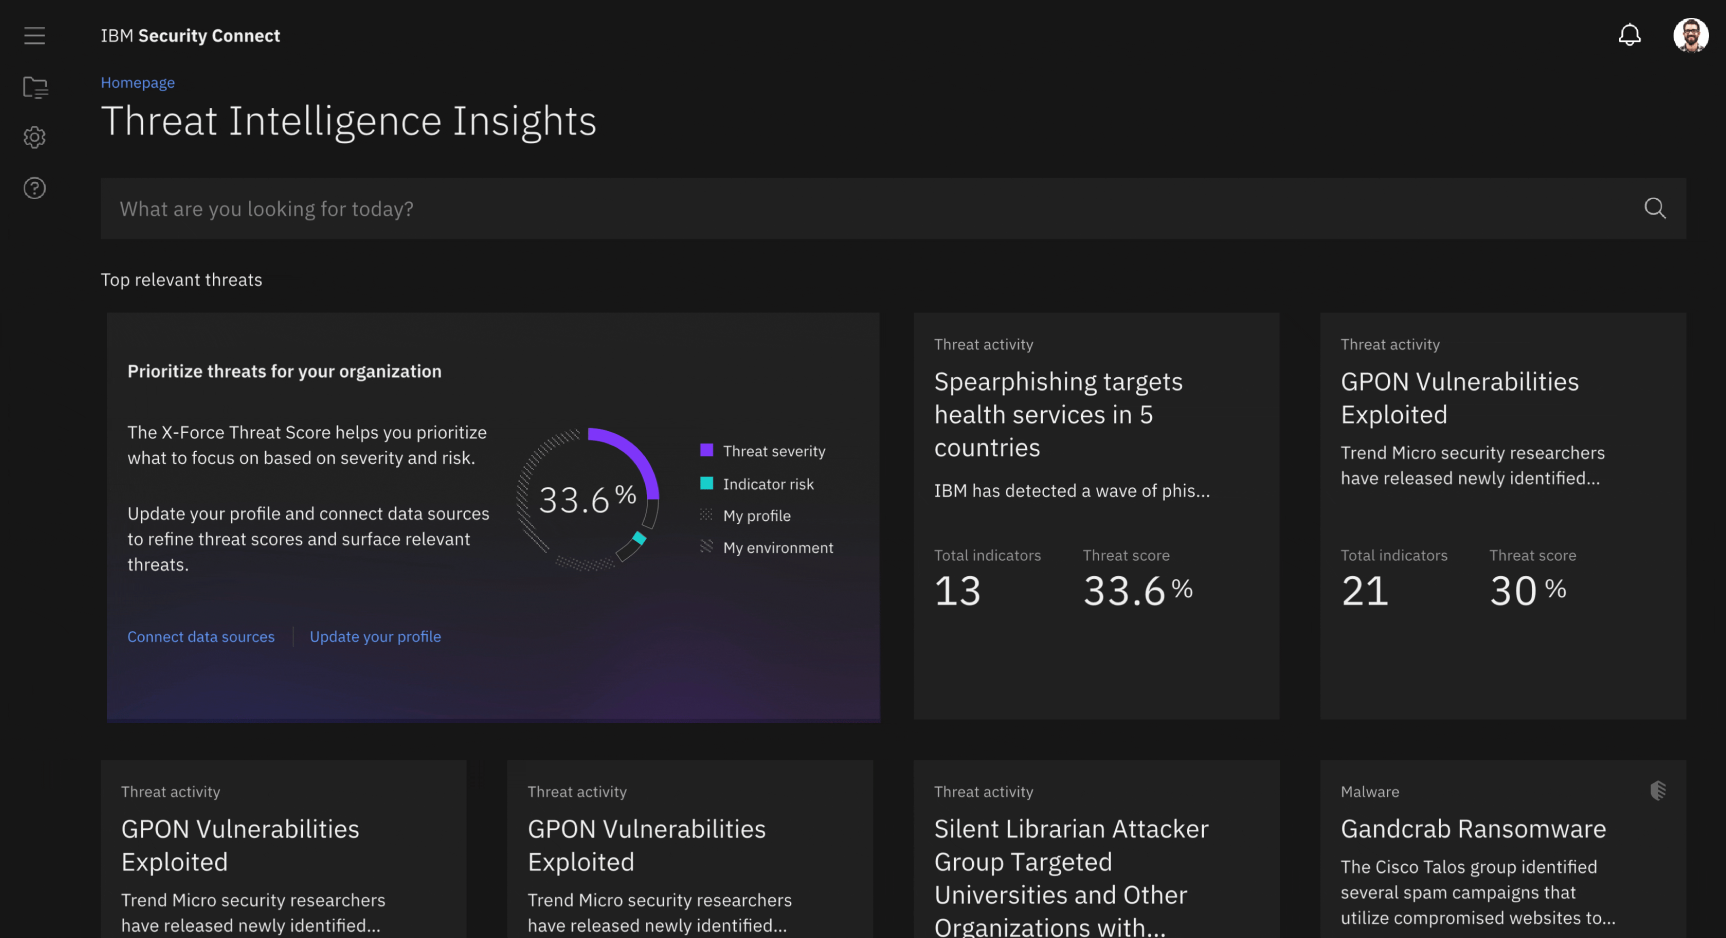
Threat Intelligence Insights is an application on IBM’s Security Platform, designed to work seamlessly with other applications on the platform. Our teams mirrored this structure, with each of us collaborating closely across various projects. For this project, I served as the UX designer for Threat Intelligence Insights, working directly with a visual designer. As part of the broader platform team, we collaborated closely with other UX designers and researchers working on different components of the platform. I joined the team after the project had already begun, so some foundational work was in place when I arrived.
Challenge
With the growing number of cyberattacks today, security analysts face challenges in filtering out noise to focus on the most relevant and severe threats. Our core question became: How might we create a solution that helps security analysts proactively identify and protect against cyberattacks?
Threat score
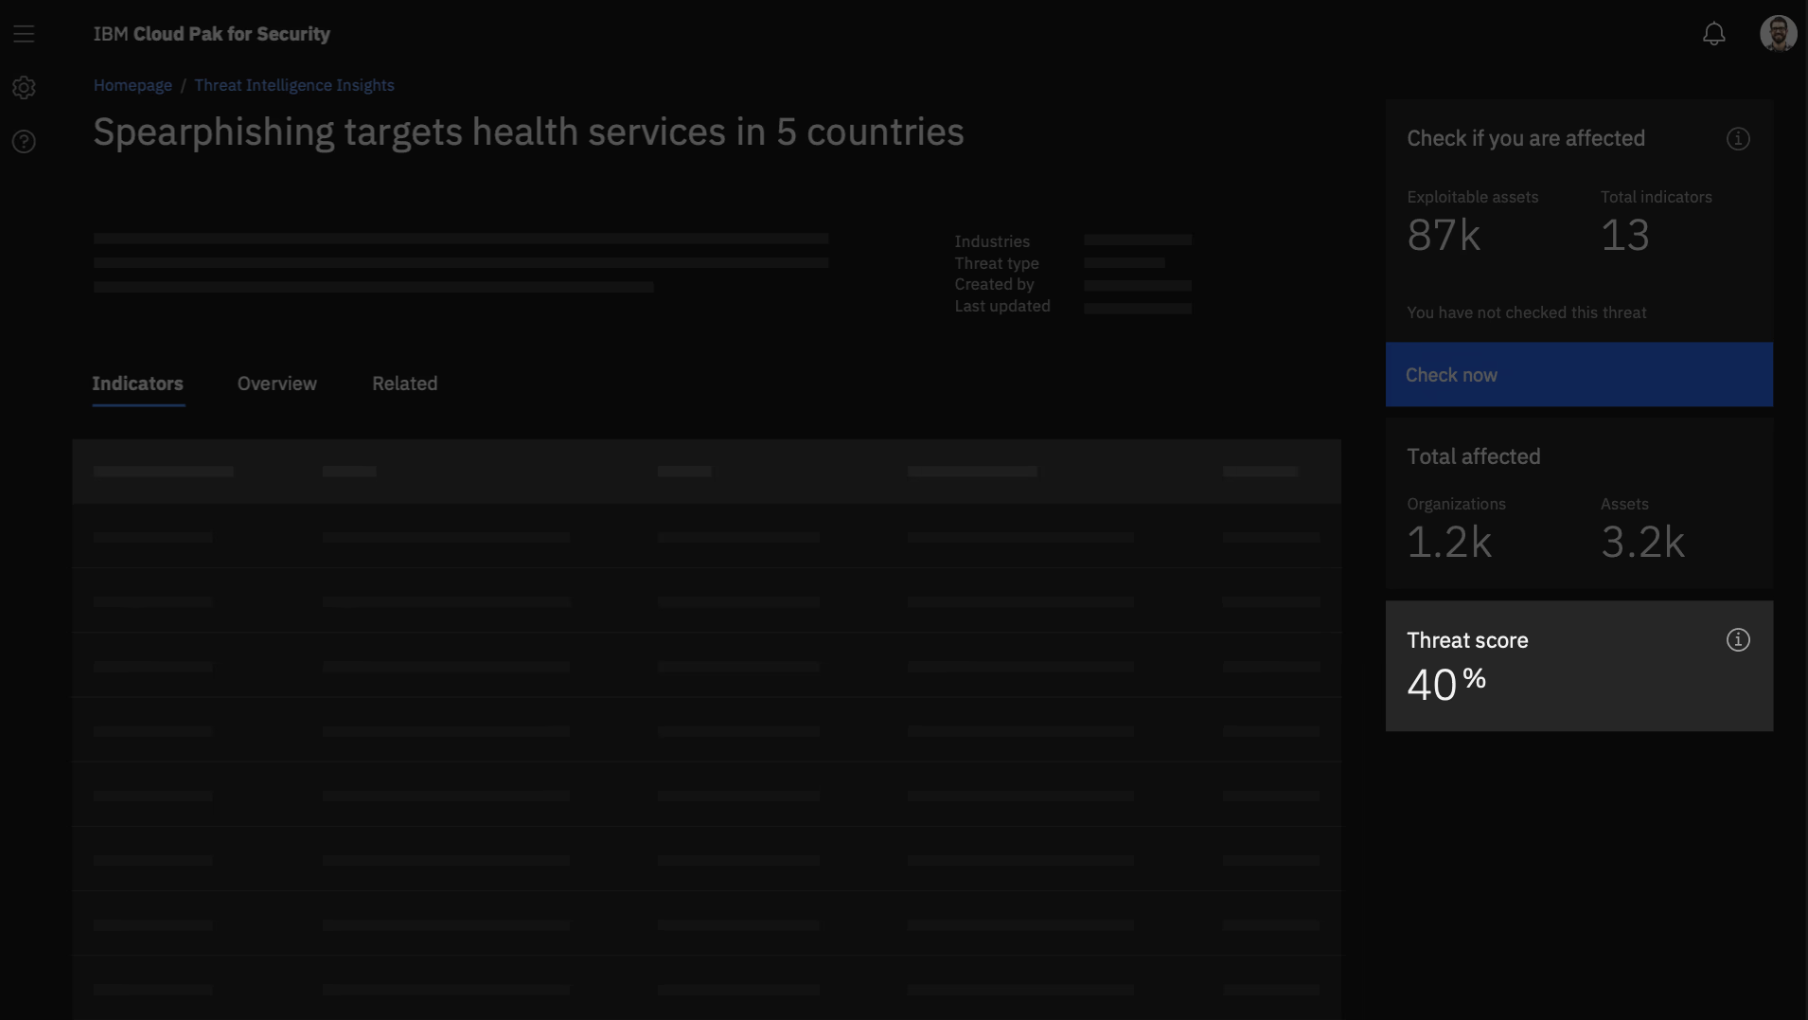
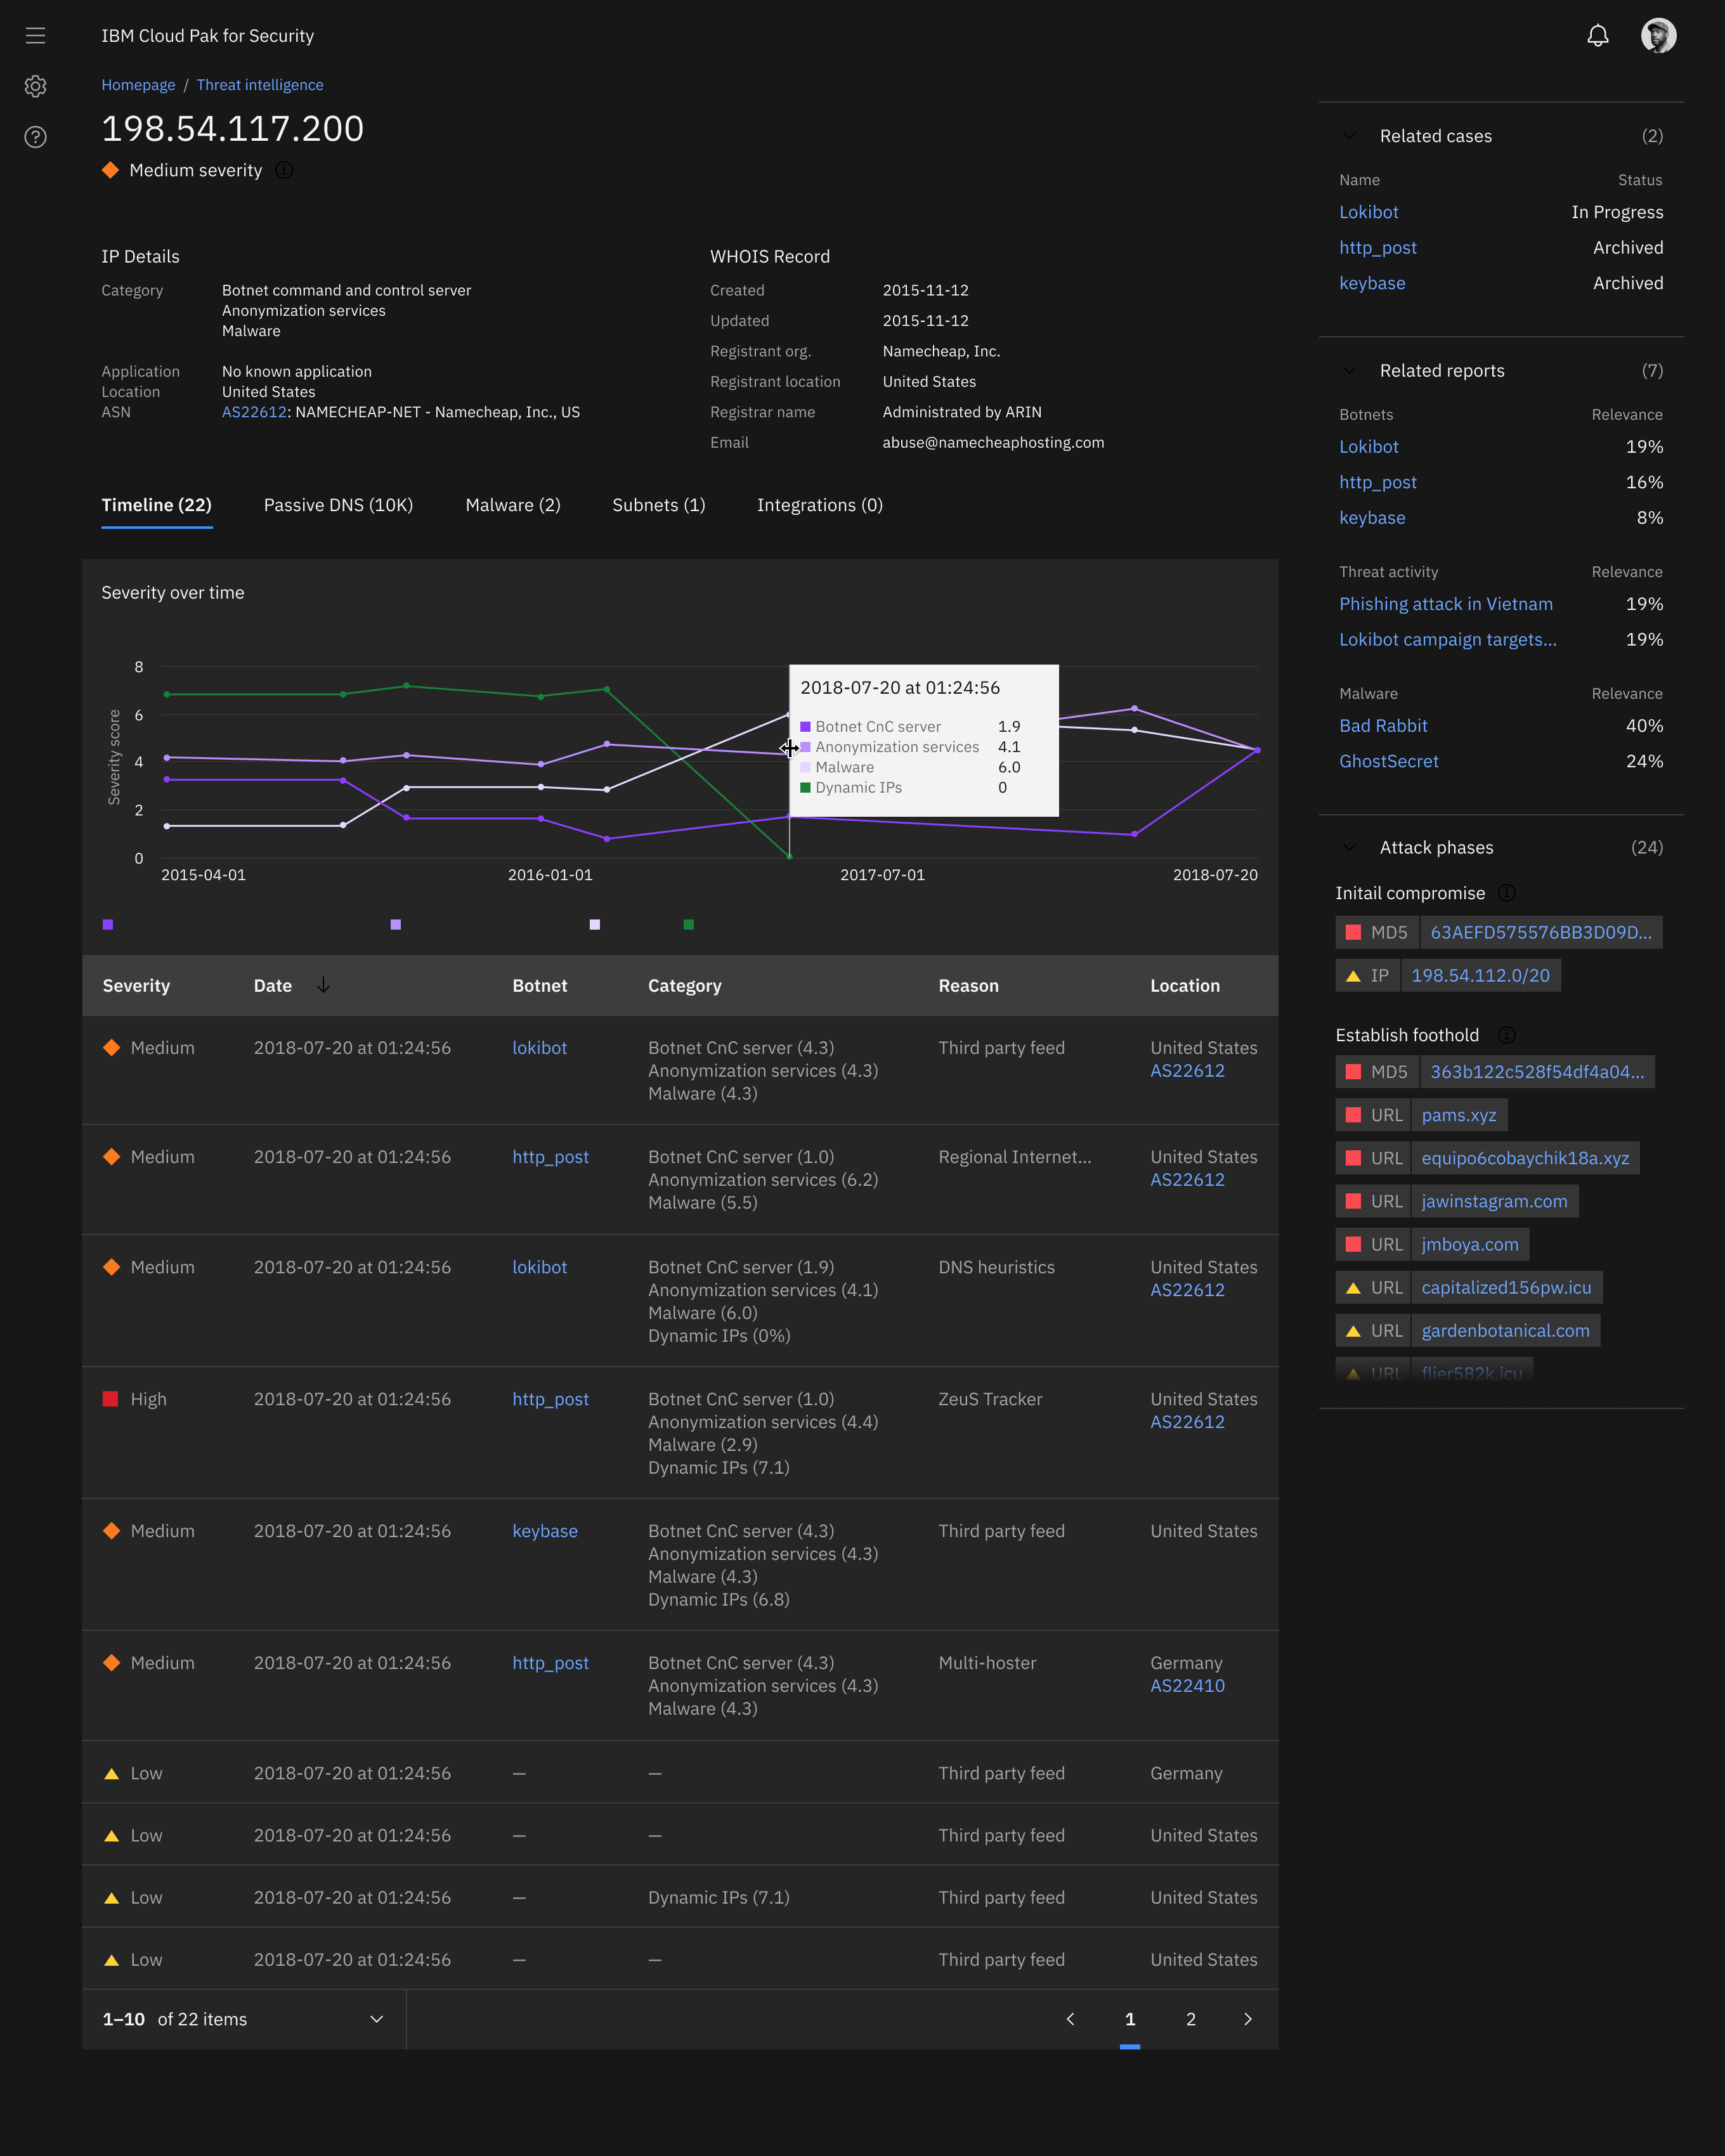
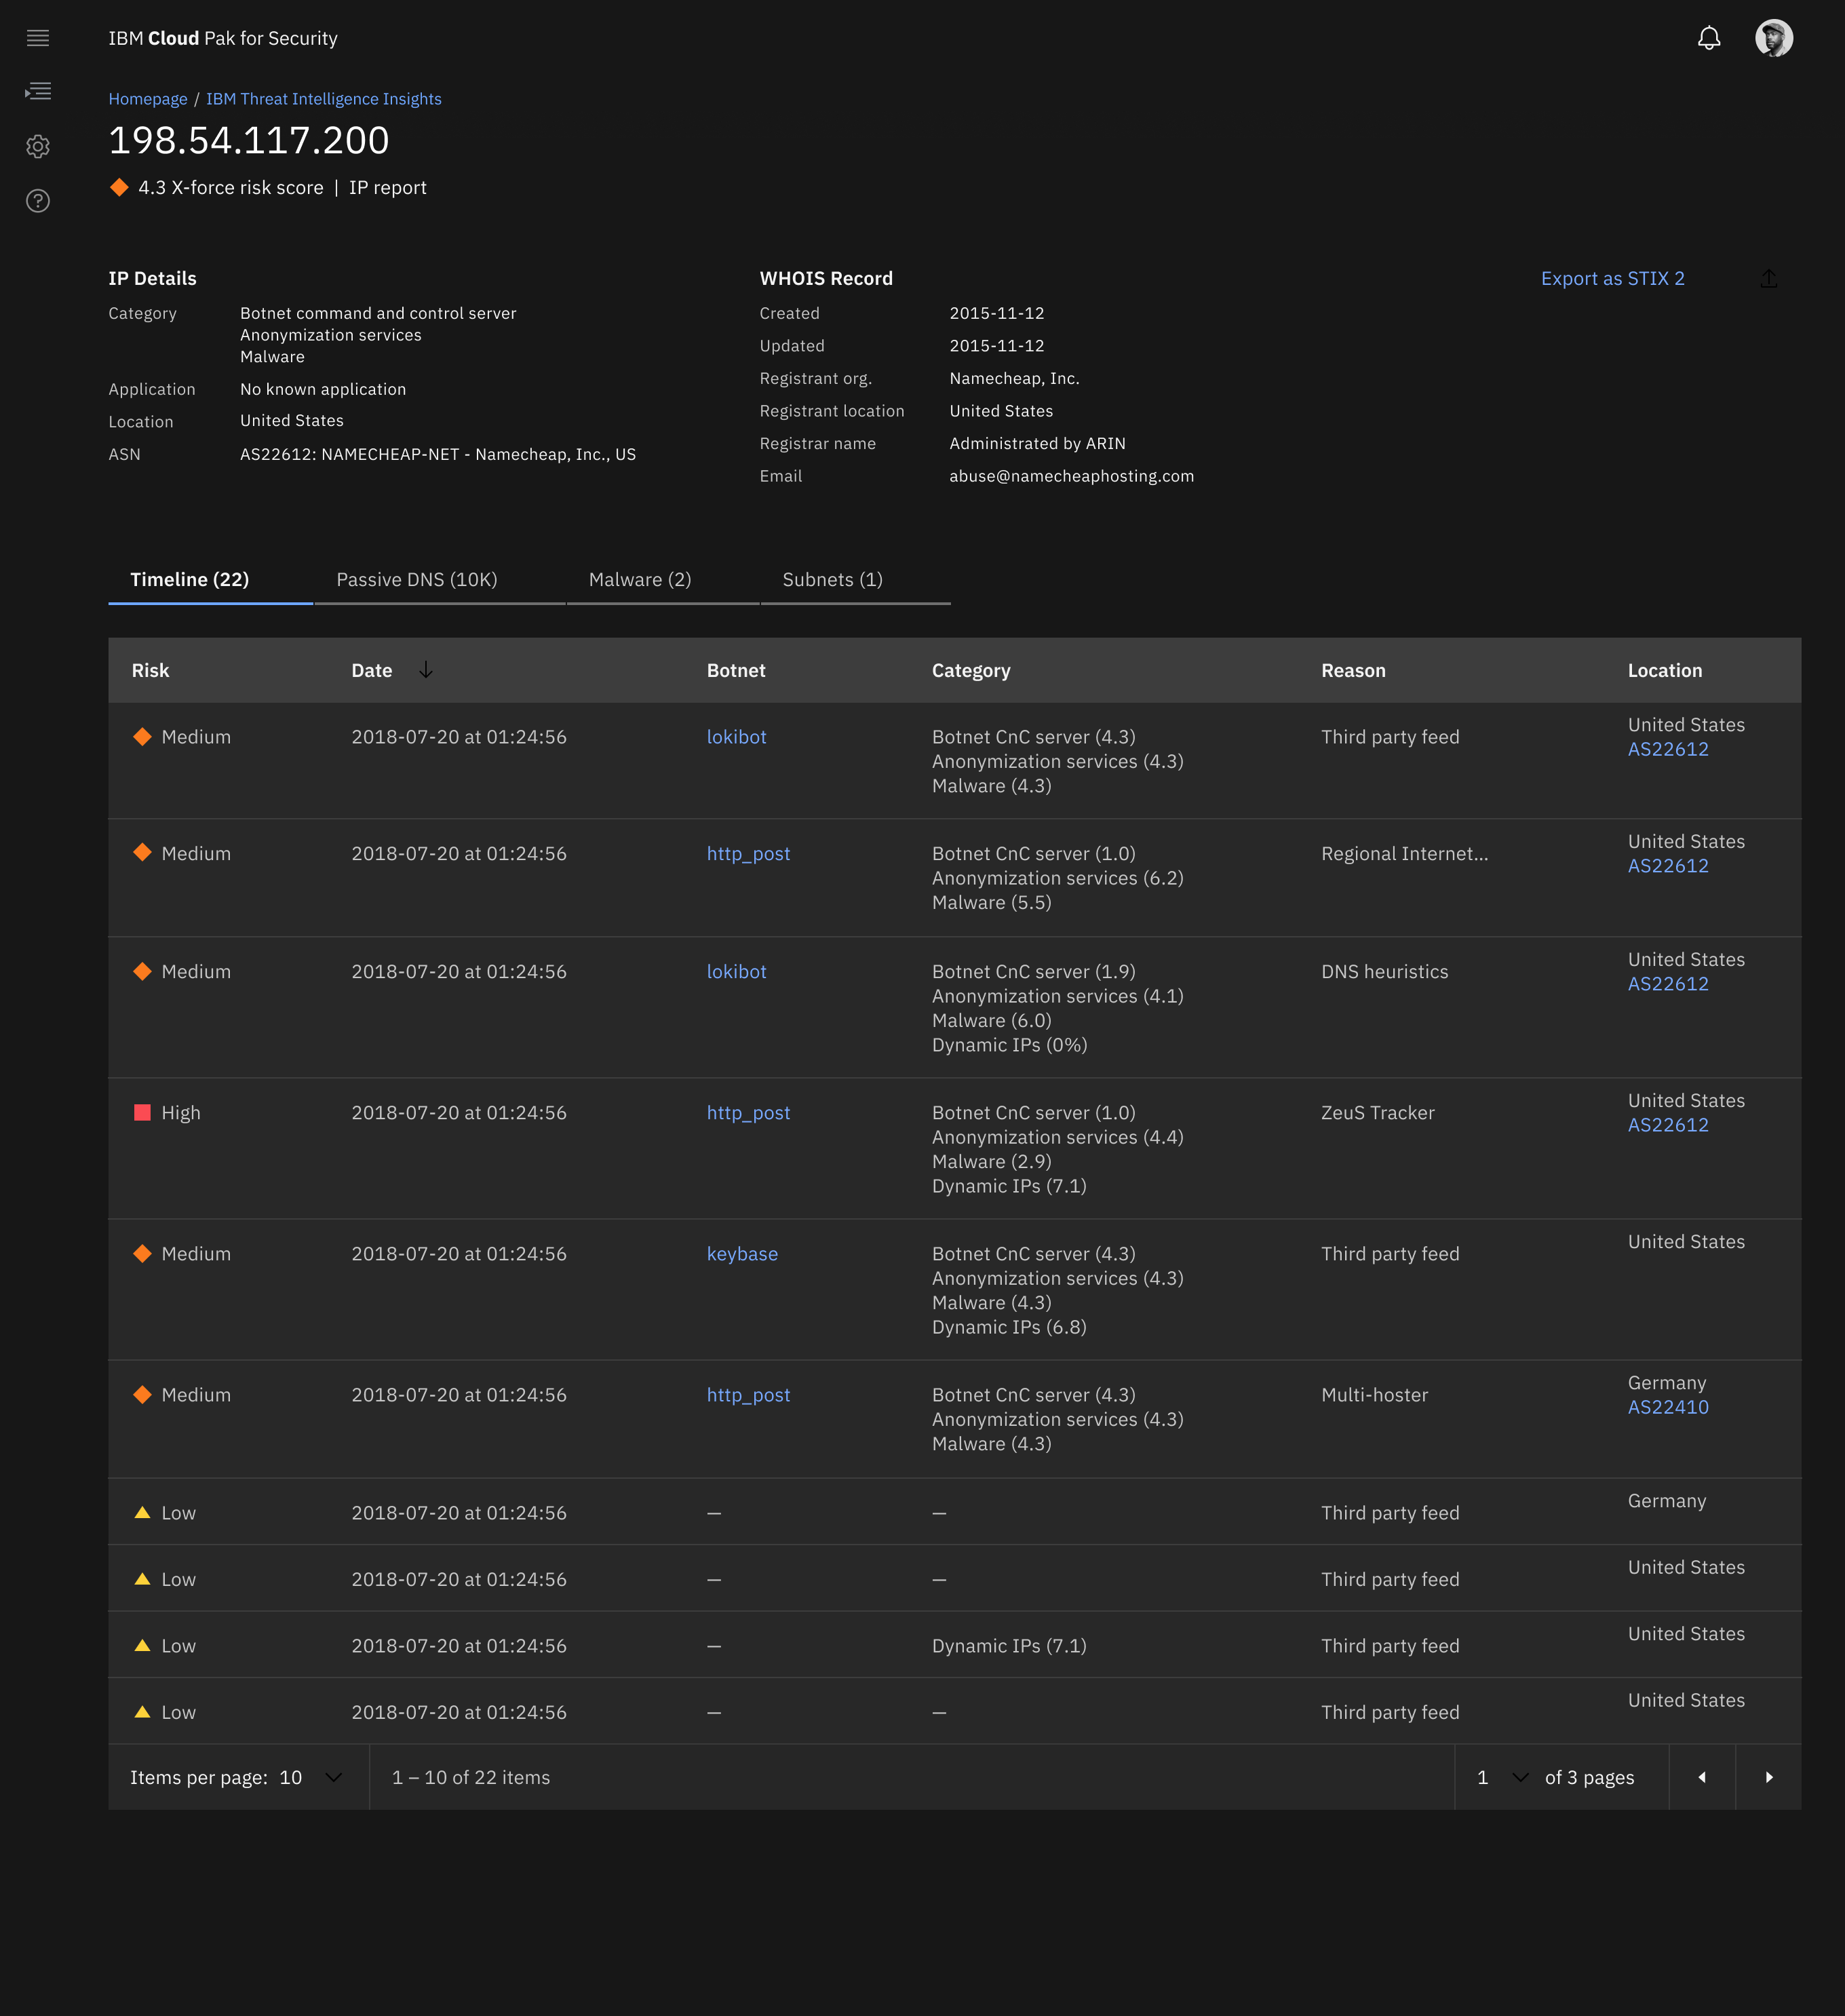
Although I was responsible for the UX design of the entire application, one problem I want to highlight specifically is around transparency in the threat score. The threat score is a feature that is intended to help security analysts prioritize threats. It indicated to users how relevant a threat is to their environment and how severe it may be.
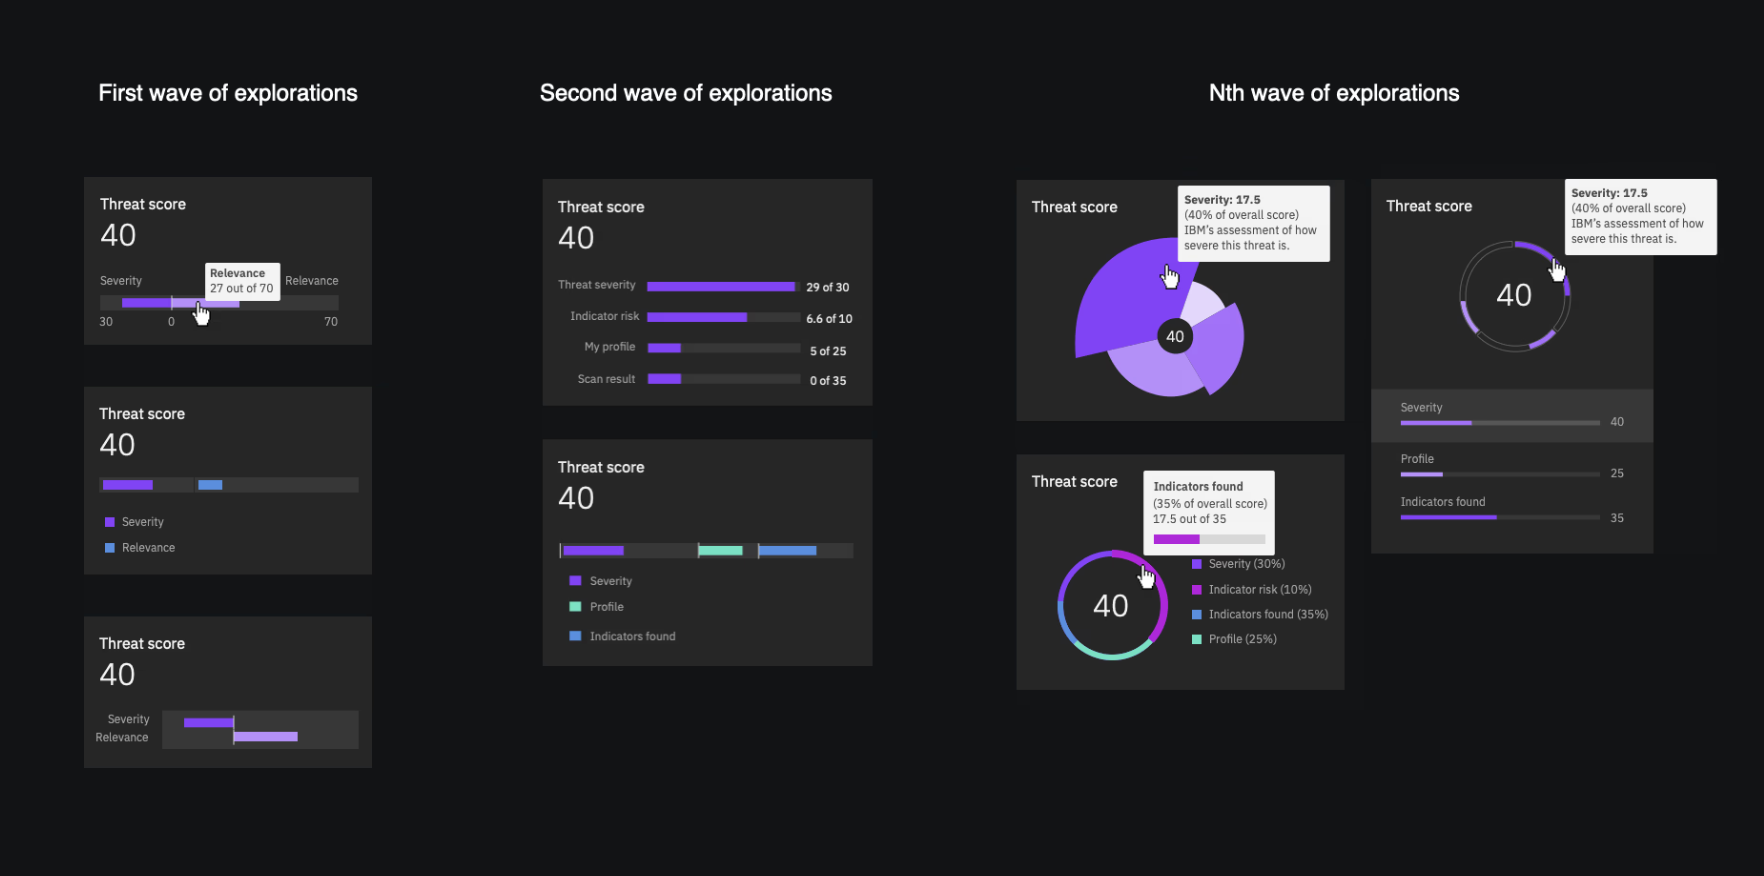
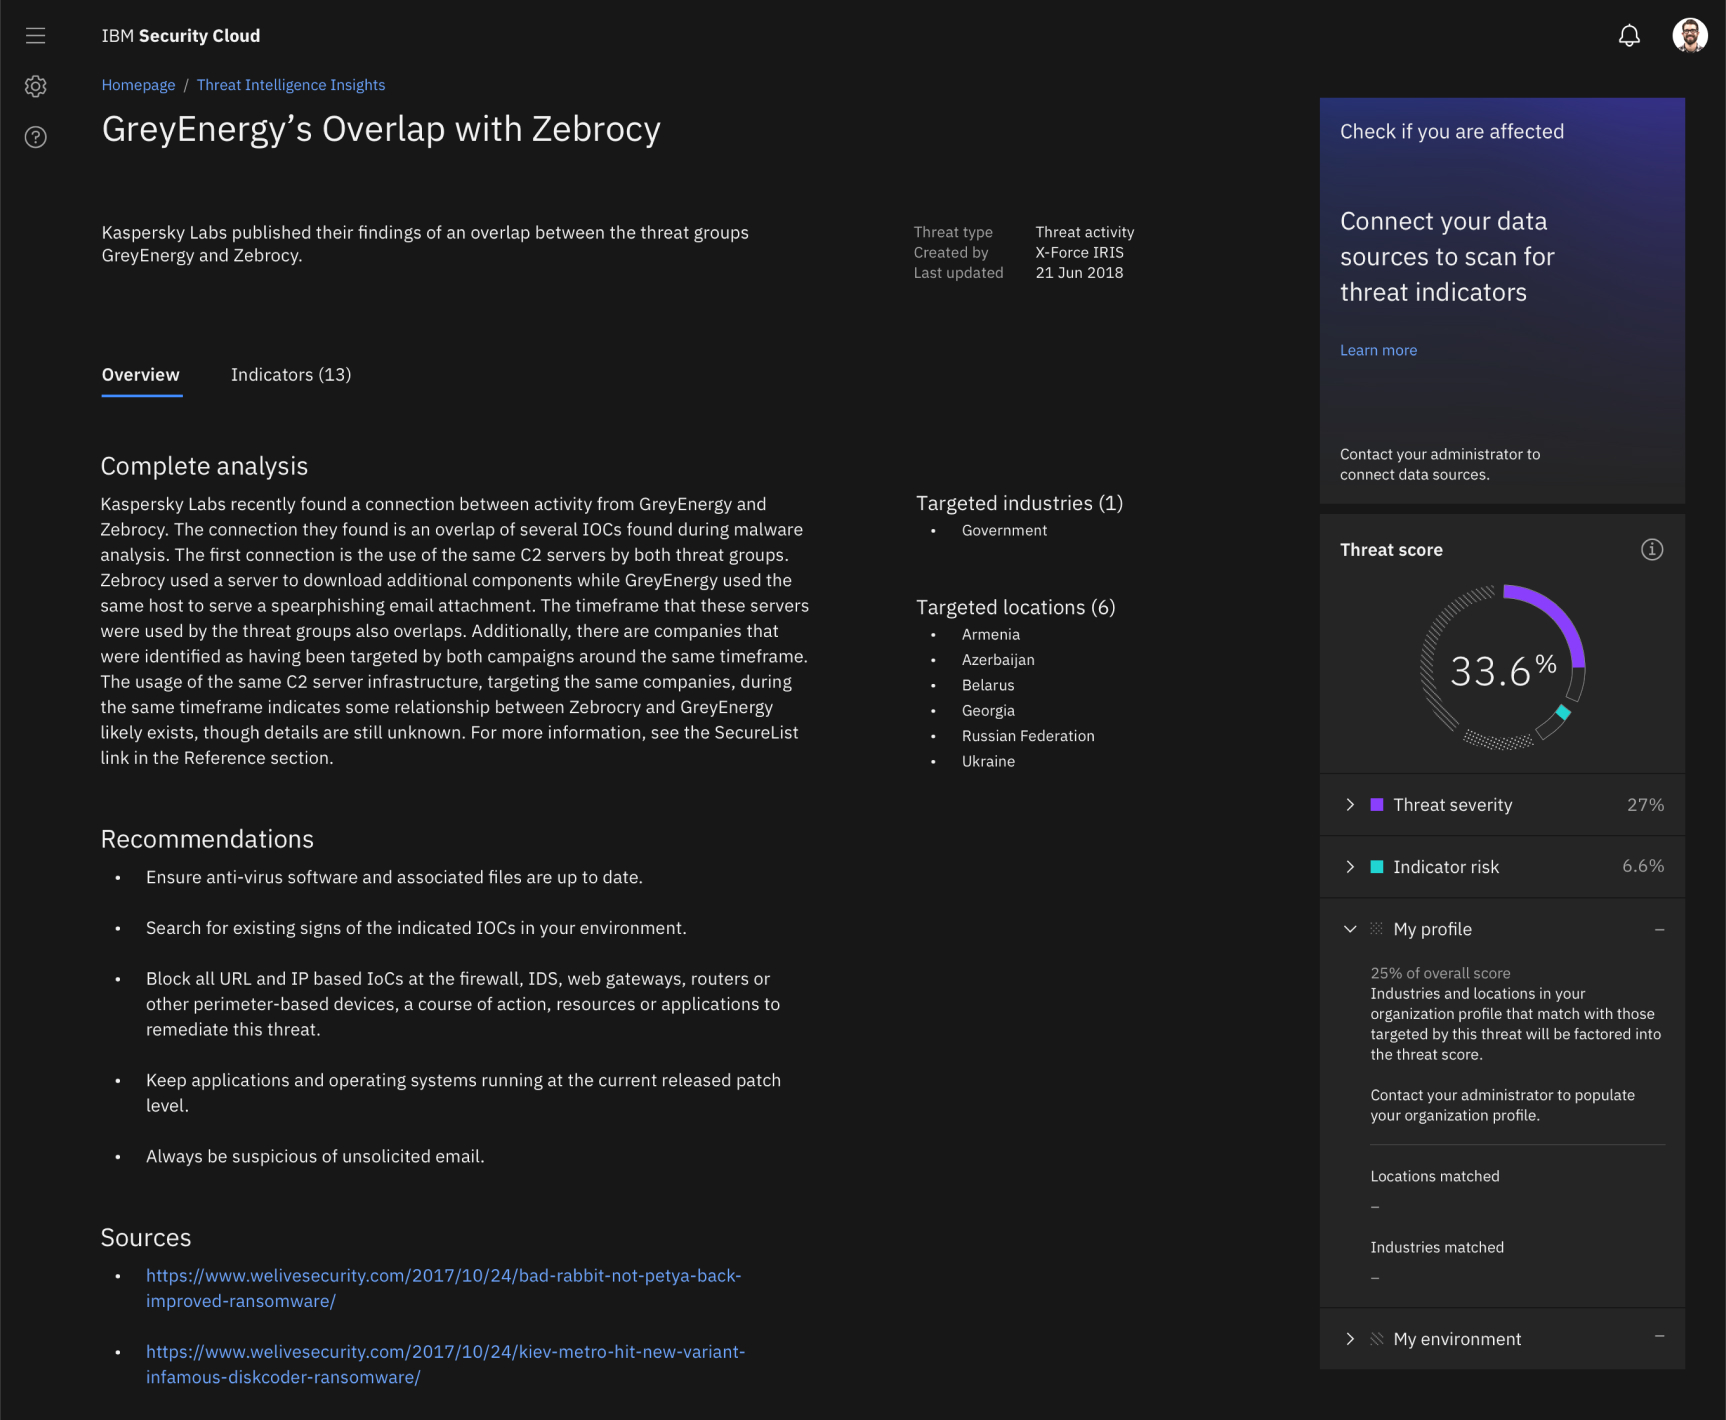
Initially, the design team chose to display the threat score as a percentage. However, through user research, we discovered that users didn’t understand what the score represented or how it was calculated. They lacked trust in the score and wanted more transparency in the calculation process, allowing them to explore the underlying algorithm if necessary.
Explorations
Solution
Contributions
My contributions included delivering user flows, creating high-fidelity mockups and prototypes, and designing the end-to-end user experience for Threat Intelligence Insights. I also coordinated with product managers and engineers to align stakeholders, support design implementation, and help shape the product strategy to launch both the MVP and the General Availability (GA) release.
Some of my most notable contributions to Threat Intelligence Insights include defining and establishing the foundation for the application’s information architecture, designing and delivering the onboarding experience to help users get started, and creating an end-to-end data visualization to help users prioritize threats.
Additionally, I established best practices for UX artifacts such as user flows and concept models for the UX team. In collaboration with another UX designer I helped standardize these practices across the broader UX Security team.