Customer Analytics Reporting
Context
During my time at IBM, I worked on an analytics platform that provides users with a comprehensive view of their end-to-end customer experience. The project’s goal was to create a flexible reporting tool that enables data analysts to generate reports, analyze data, and surface insights at the “speed of thought,” improving efficiency and ensuring that our tools keep pace with user needs.
Research
Our early research involved speaking with users of Digital Analytics, our legacy web analytics reporting product, which is being integrated into Watson Customer Experience Analytics. Through initial interviews with sponsor users and design exercises with product managers from Digital Analytics, we identified users’ key frustrations with the current reporting experience. We also conducted a competitive market analysis to ensure we met parity with our competitors.
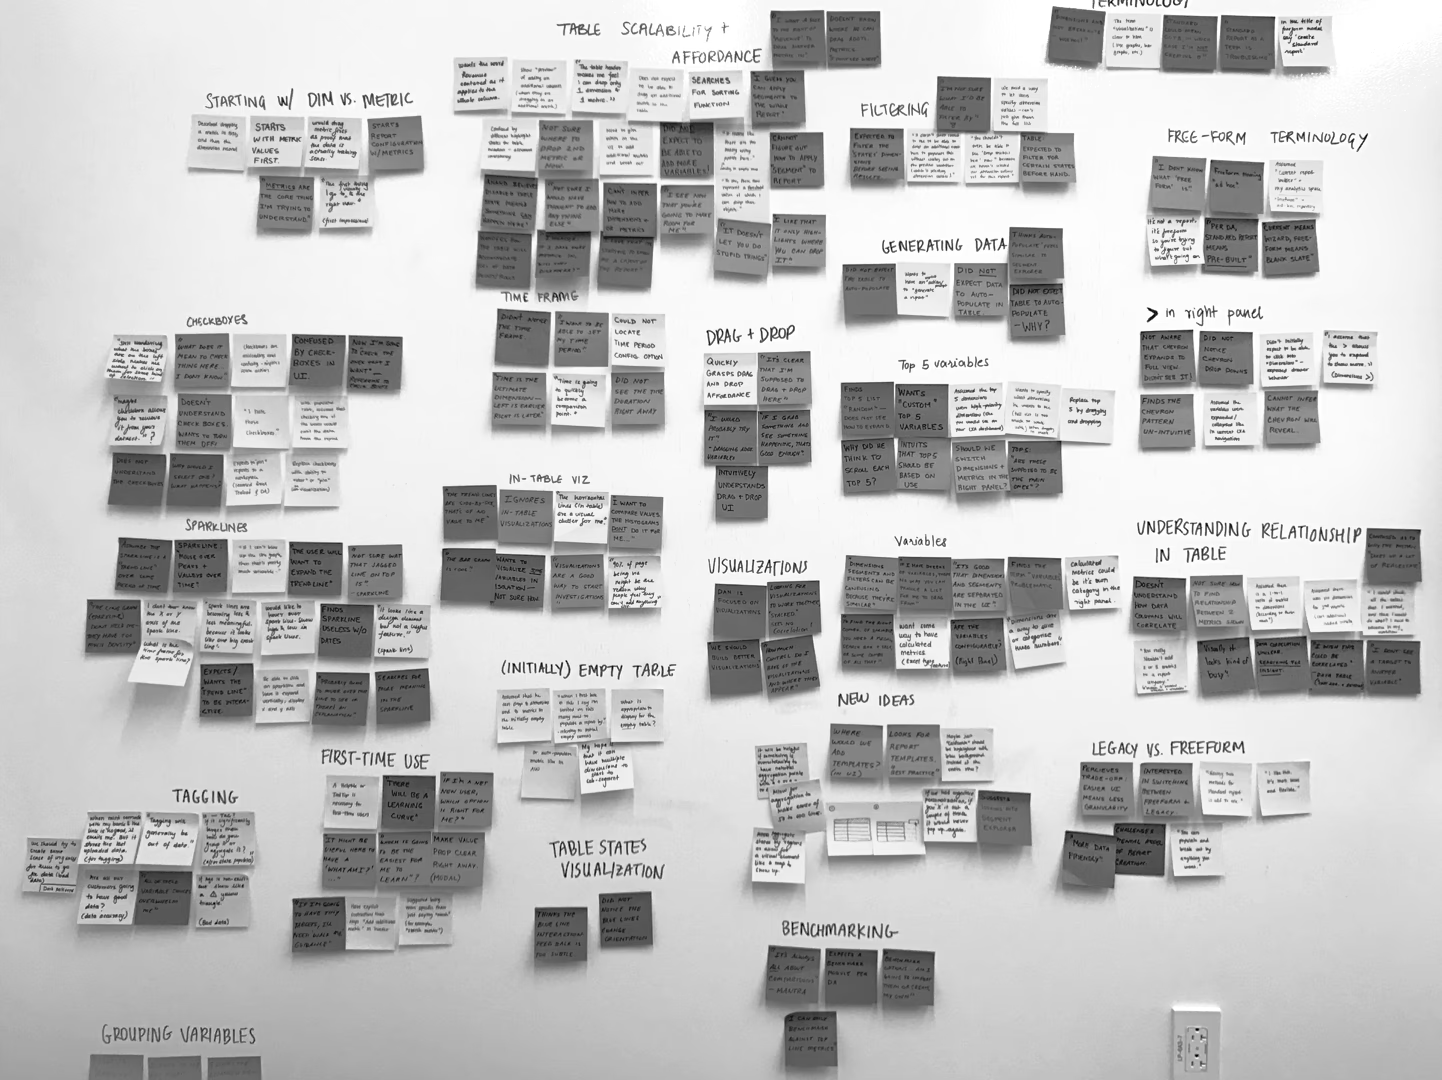
The biggest pain points were flexibility and speed. With the current design, the UI wasn’t flexible enough to allow analysts to use the tool quickly in order to get insights. Reports would sometimes take hours or days to generate, and so we knew it was important to work with our development teams to optimize for speed.
“Reports take a long time and applying segments has unknown processing time. Frustrating because if it’s a same-day need, we can’t reliably get answers.”
Solution
Instant results
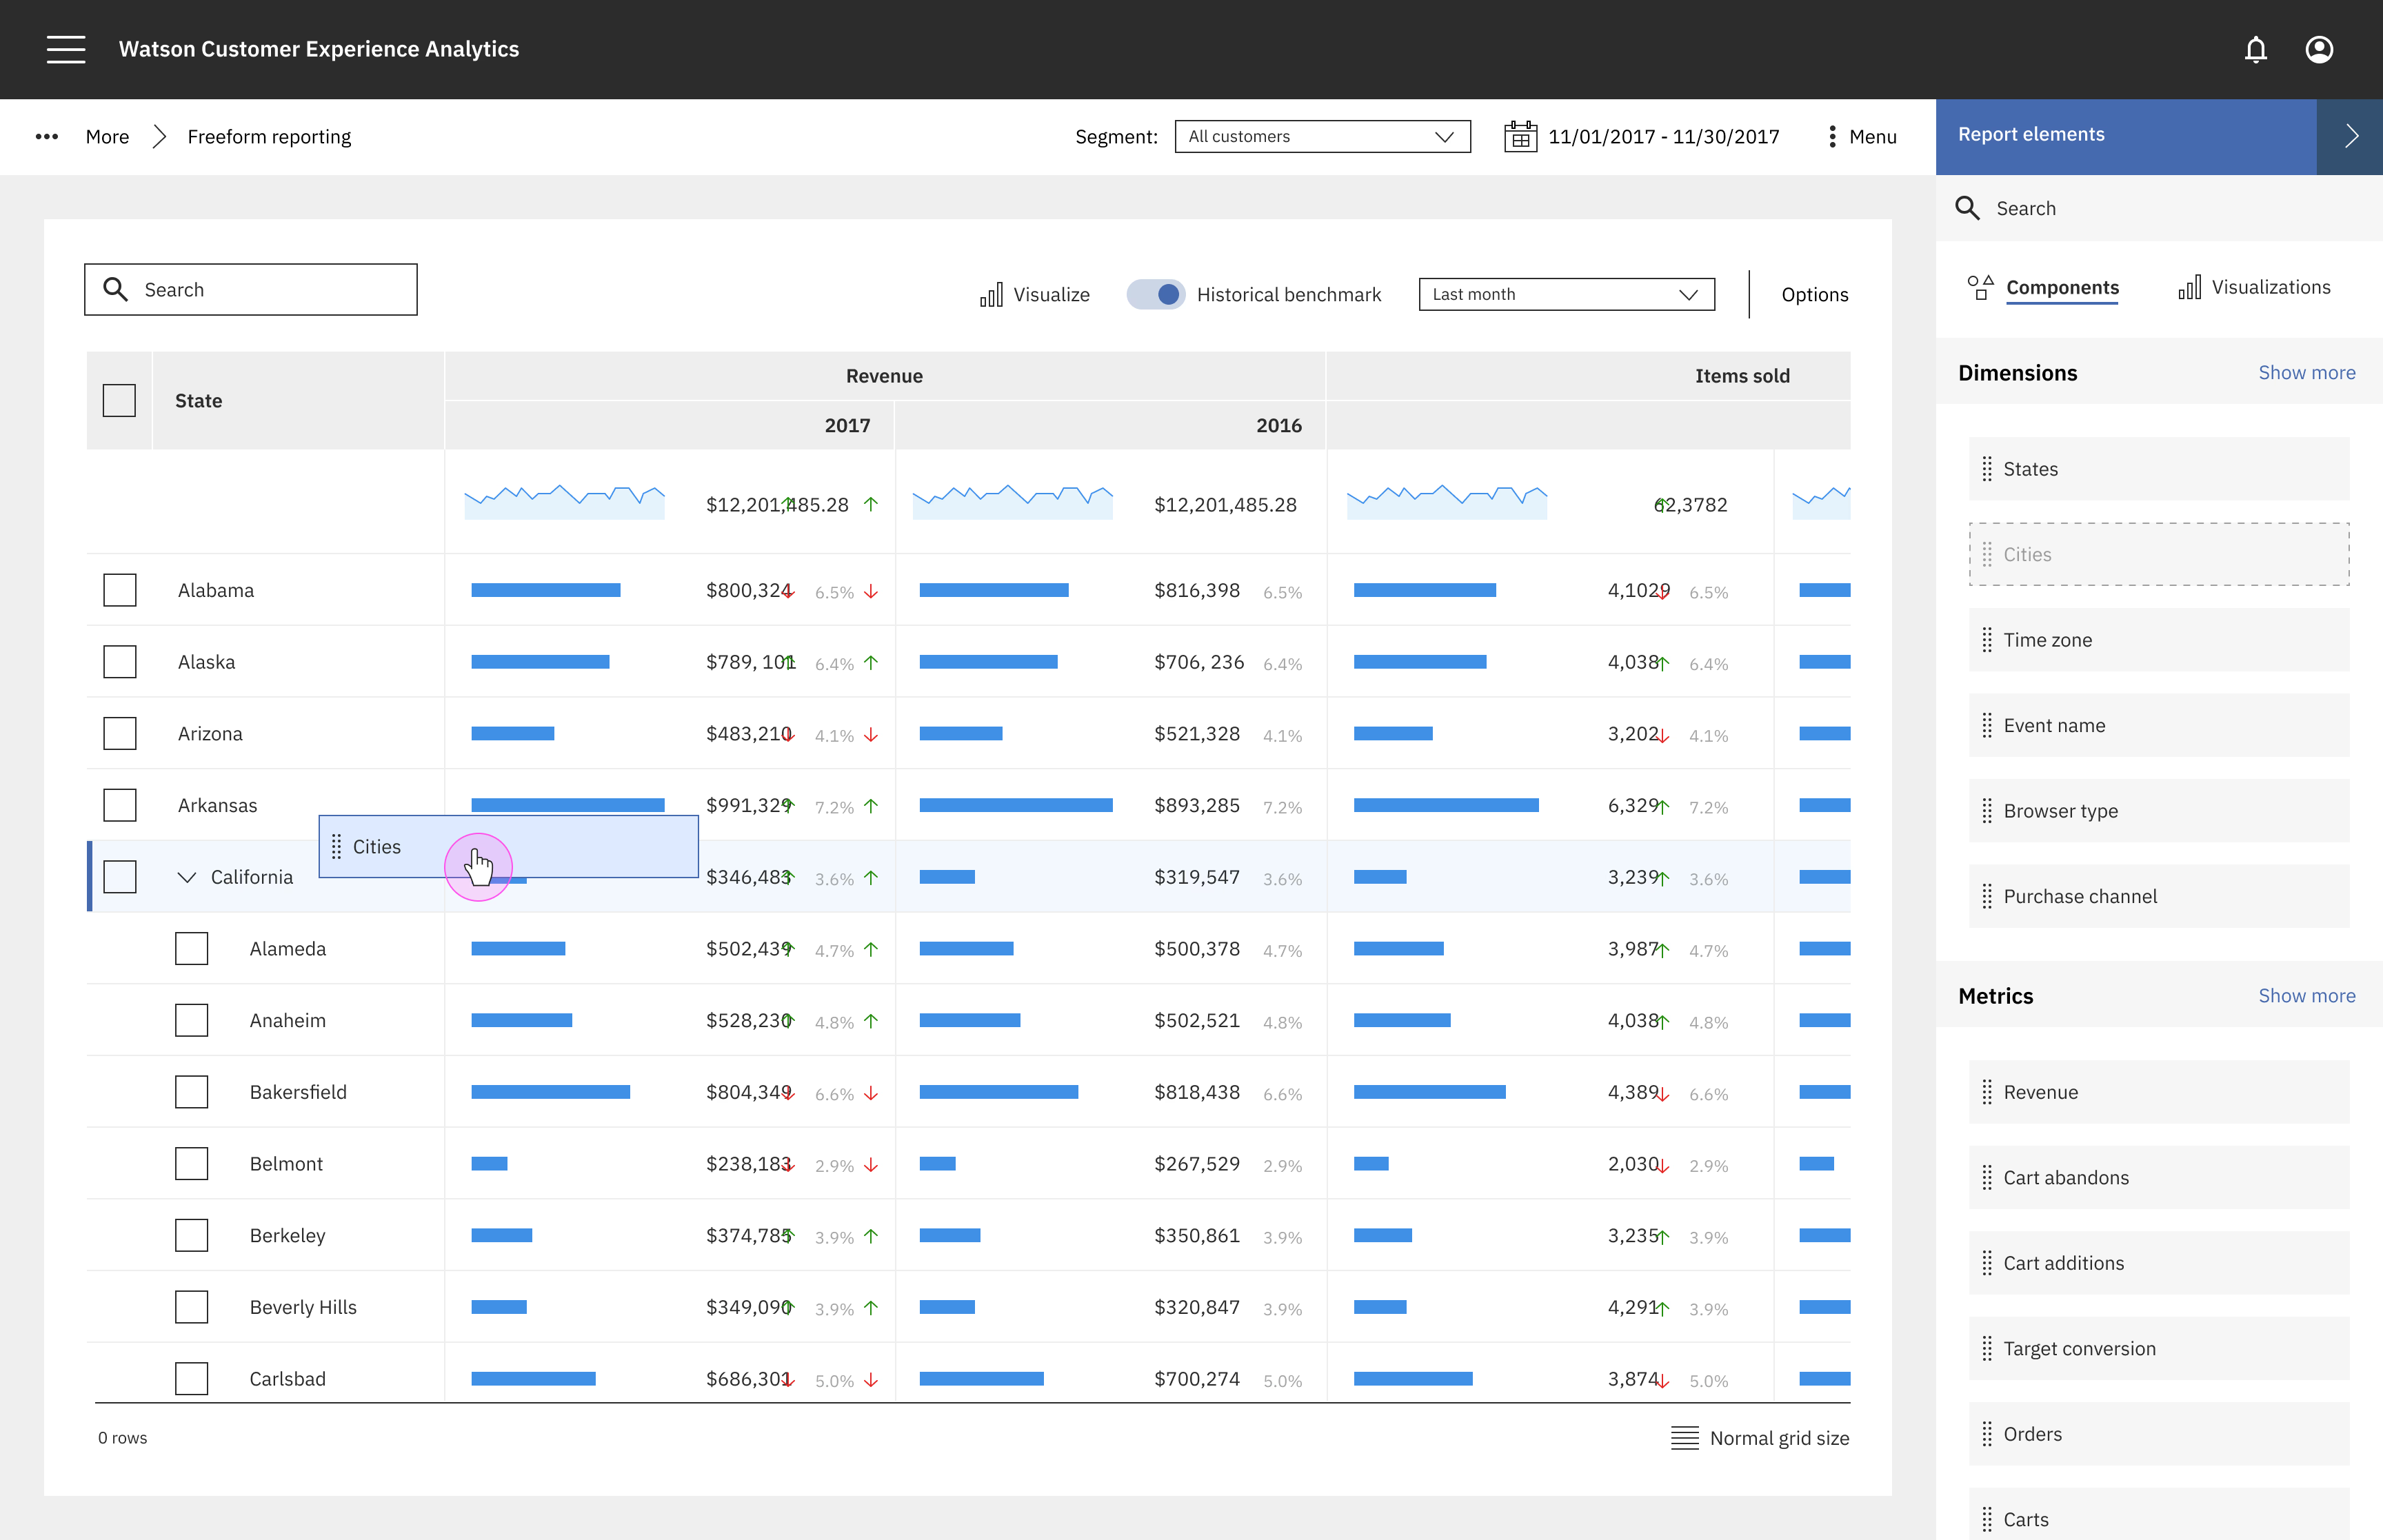
Our users’ biggest frustration was waiting hours for report results. With an easy drag and drop UI, the data analyst can add metrics, dimensions, and segments to the table and see immediate results. He can quickly visualize the data by dragging in visualizations.
Splice & dice data
With the legacy design, the user must plan ahead and know exactly what report he is going to build before generating it. The new design allows the user to splice and dice data in multiple ways, and pivot at the speed of thought, leaving the user to gain insights quickly and effectively.
Data visualizations
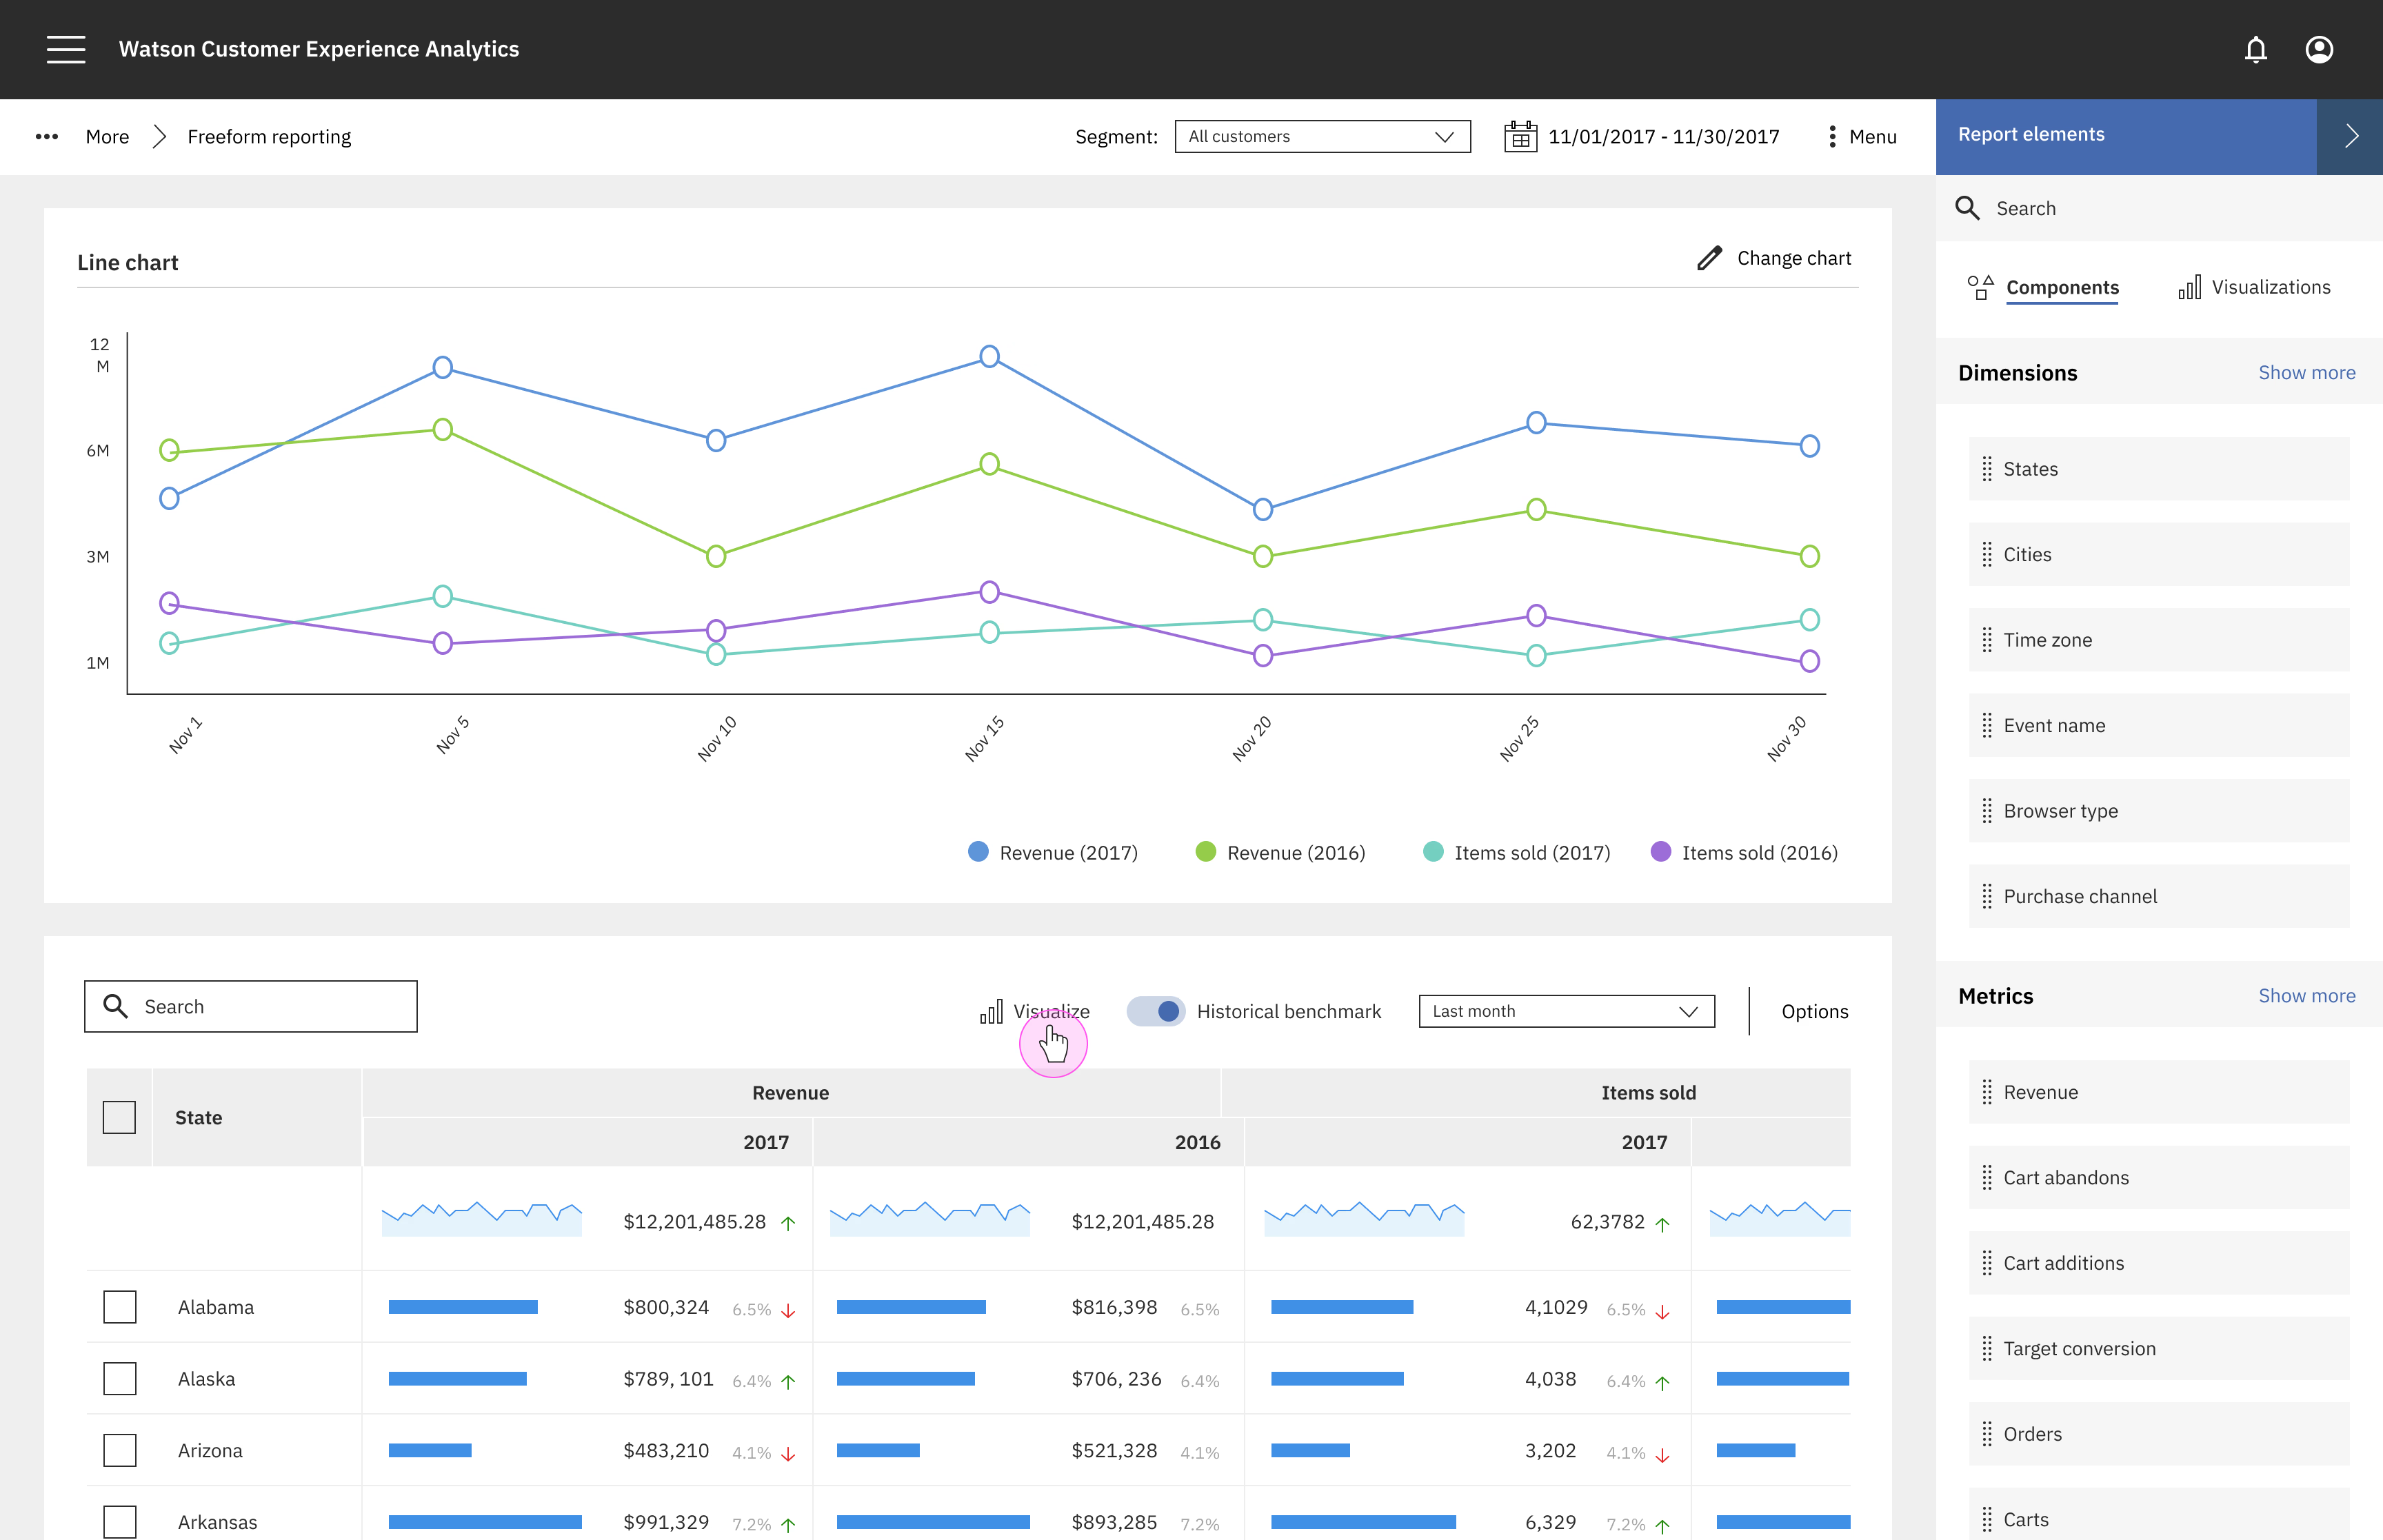
Informative visualizations can be invoked from any data or data sets right from the table, allowing analysts to see a high level view of aggregate summary view of their data.
Quick benchmarking
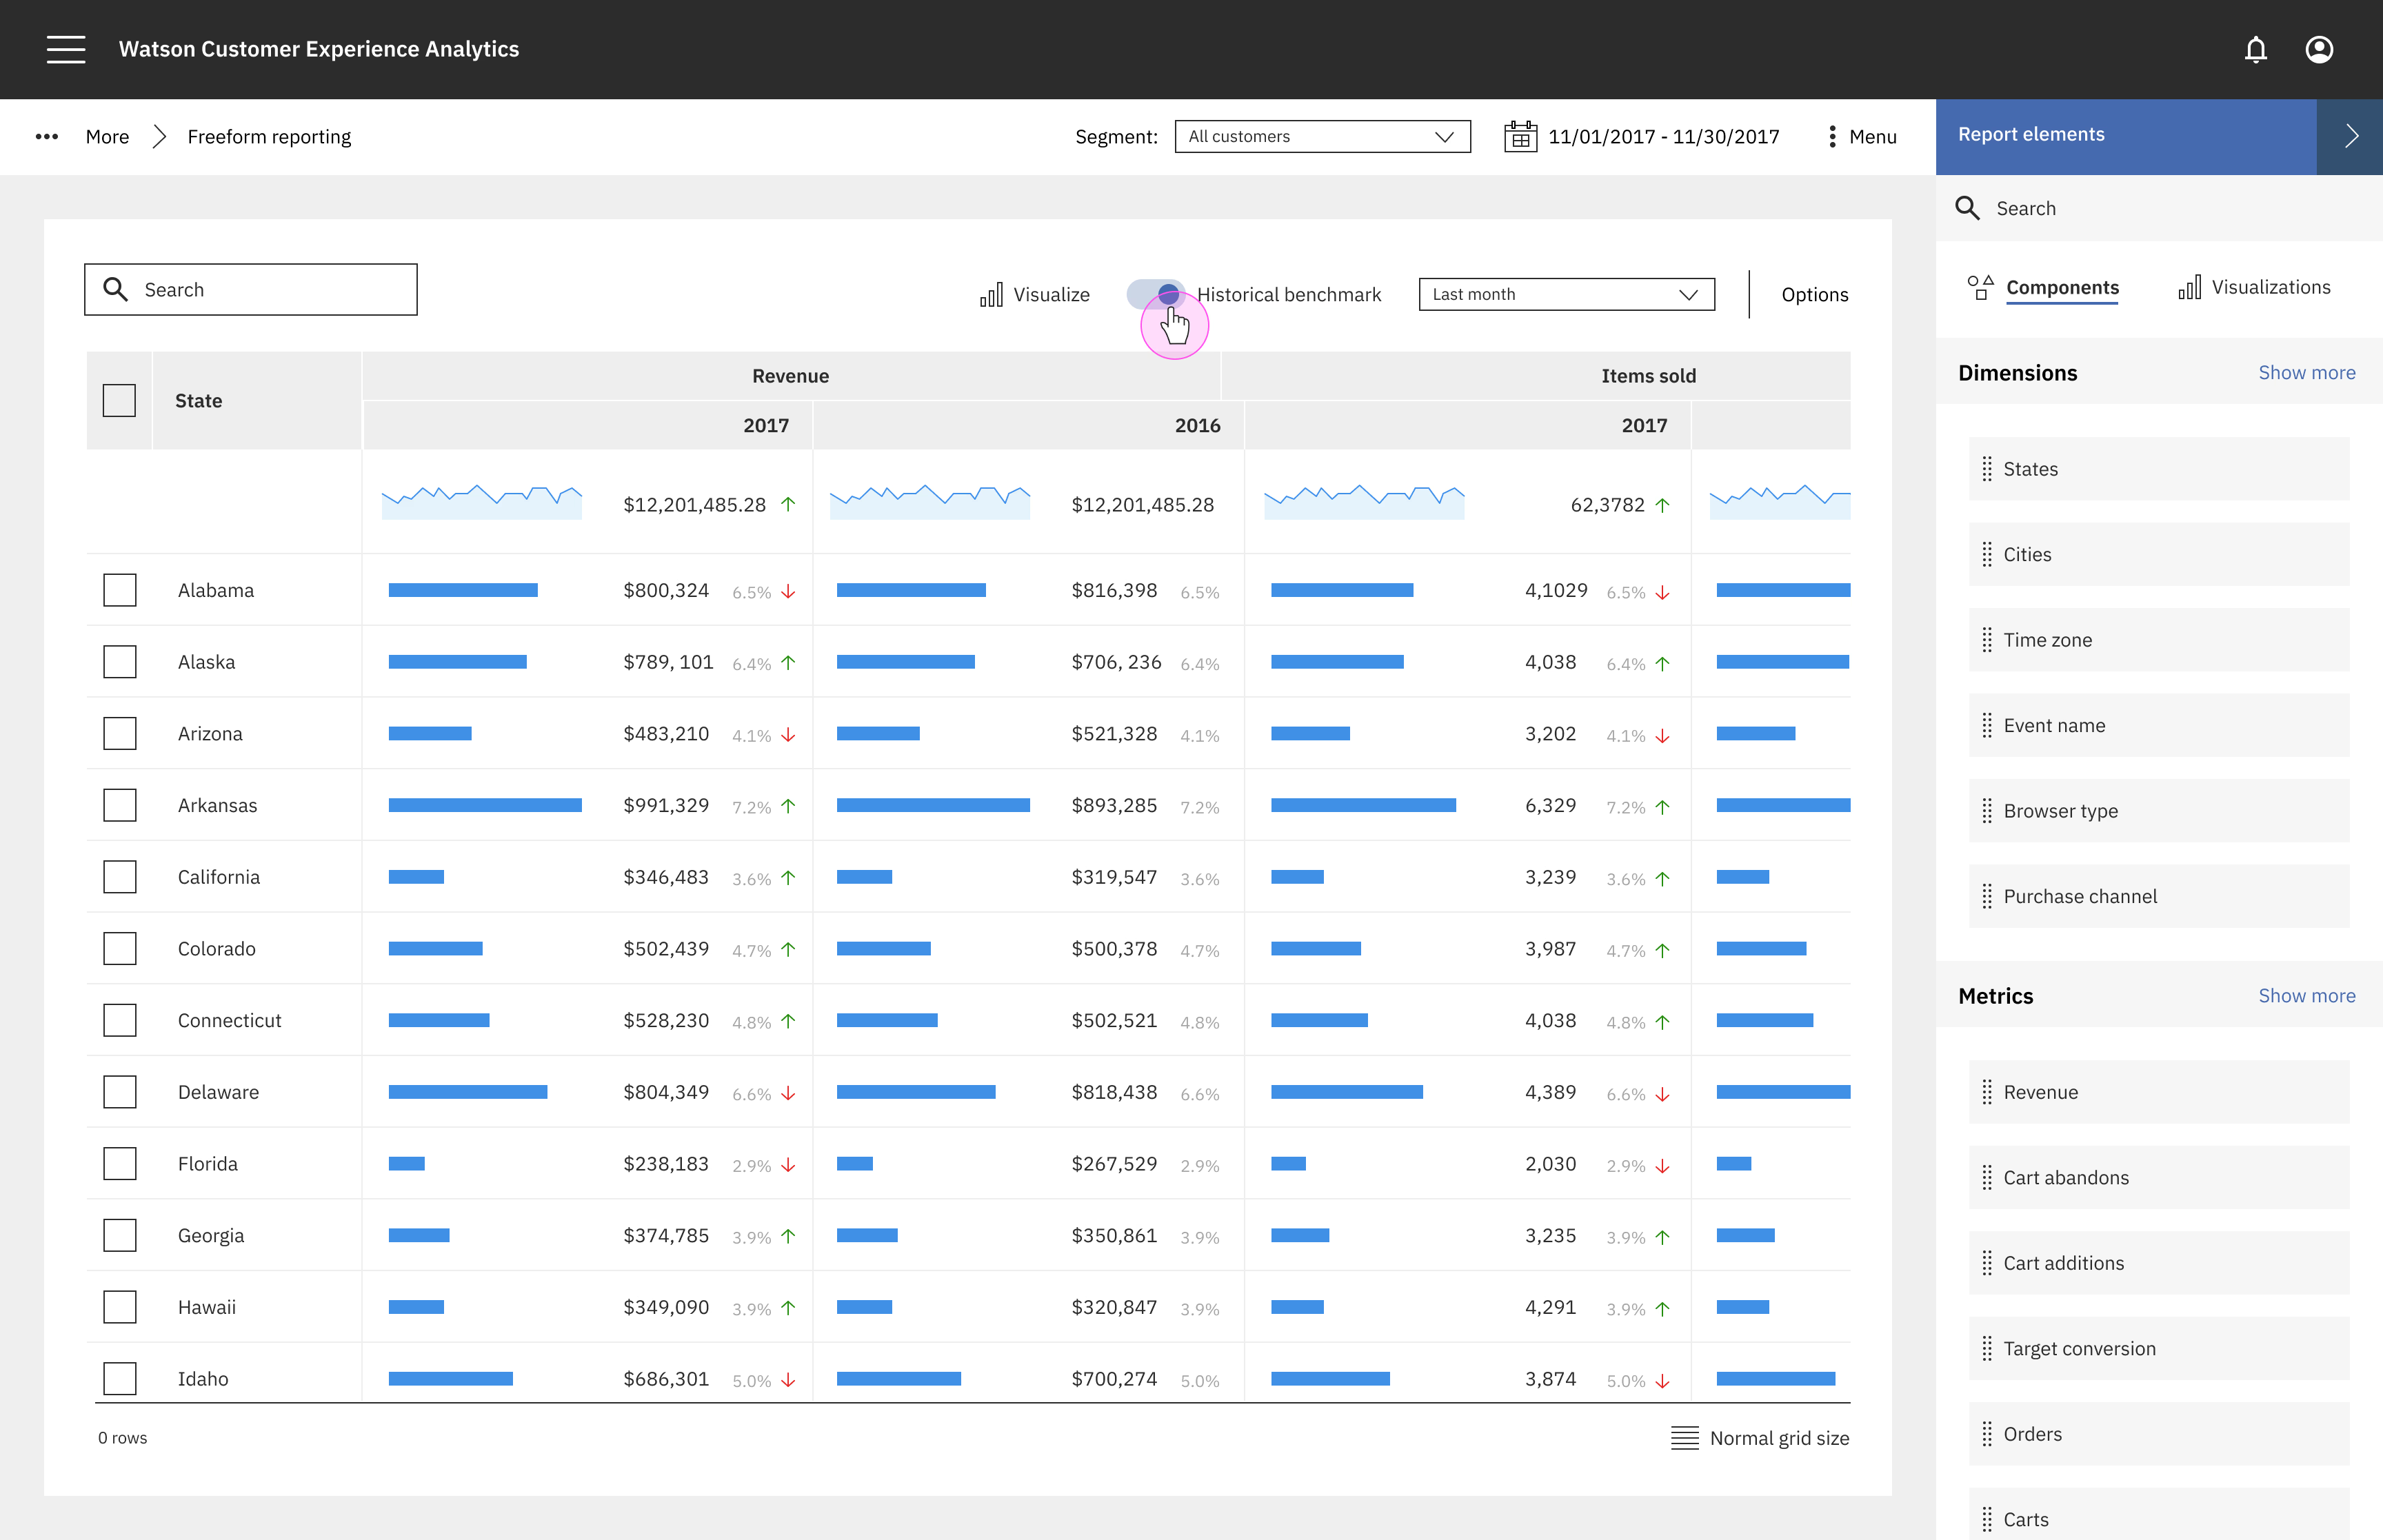
One of the most common actions we saw amongst analysts was comparing results over time periods. For this reason, we designed a quick benchmarking toggle so that comparing how a company is performing compared to the past can be done in a single click.
Contributions
My contributions to this project included working cross-functionally with PM, engineering, and business stakeholders to align on the product strategy. I worked closely with our user researcher to synthesize insights and then translate them into end-to-end high fidelity designs and prototypes.